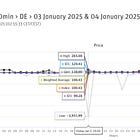
On over- and under-shooting DA expectations
Box and Scatter
The common theme in these developing short reviews of ID market developments is to try and get into market dynamics using simple methods on minimal data (summary statistics and outliers).
We started with an exploration of simple measures of liquidity.
Then we compared volume-weighted-average prices over different time periods (full-trading period, three hours, one hour). This gave a sense of tightening/loosening conditions in the market.
Last time we added Day-Ahead prices and developed a plot that made it possible to isolate periods of progressively tightening conditions.
The year progresses and more examples arise. We can now look at a day when the ID market situation was mild compared to DA expectations. Mild in the sense of “it could have been worse.”
We saw previously that 09.01.2025 was a special day. There was a clearly visible double-whammy of tightening for buyers visible during parts of the day: full VWAP prices were high relative to Day-Ahead prices, and there was then further tightening in the last hour of trading (high ID1 vs Full VWAP prices).
If we repeat the exercise today we find that


