
Indicators for Illiquidity in the DE Continuous ID Market
Liquidity Gaps via VWAP vs High/Low Spreads

Epexspot publishes some of its market results on an ongoing basis, see here. This year I’m going to start keeping an eye on these market results (so that you don’t have to if you don’t want to). This first post is a short reflection on illiquidity in the DE Continuous ID Market in the year so far.
Unfortunately the usage terms for this data are restrictive, so I will be cautious. In keeping with the spirit of energy market transparency, I hope that epexspot will at some point also publish data under a more permissive open license.
You will be used to much more detailed analysis if you are really interested in energy prices, but the idea here is to find the level of detail and discussion appropriate for a public post based on publicly available data.
1. Background
As I’m sure is the case for you, my LinkedIn feed features a wide range of posts about energy prices. The first one I saw in the new year was from a LinkedIn Energy Market influencer about very low Day-Ahead prices for 01-01-2025.
Shockwaves went throughout the German electricity market on the first day of 2025, with electricity prices clearing at an average 0.95€/MWh all day. Following a Dunkelflauten with prices reaching up to 800€/MWh in early December, electricity is now almost for free. Source
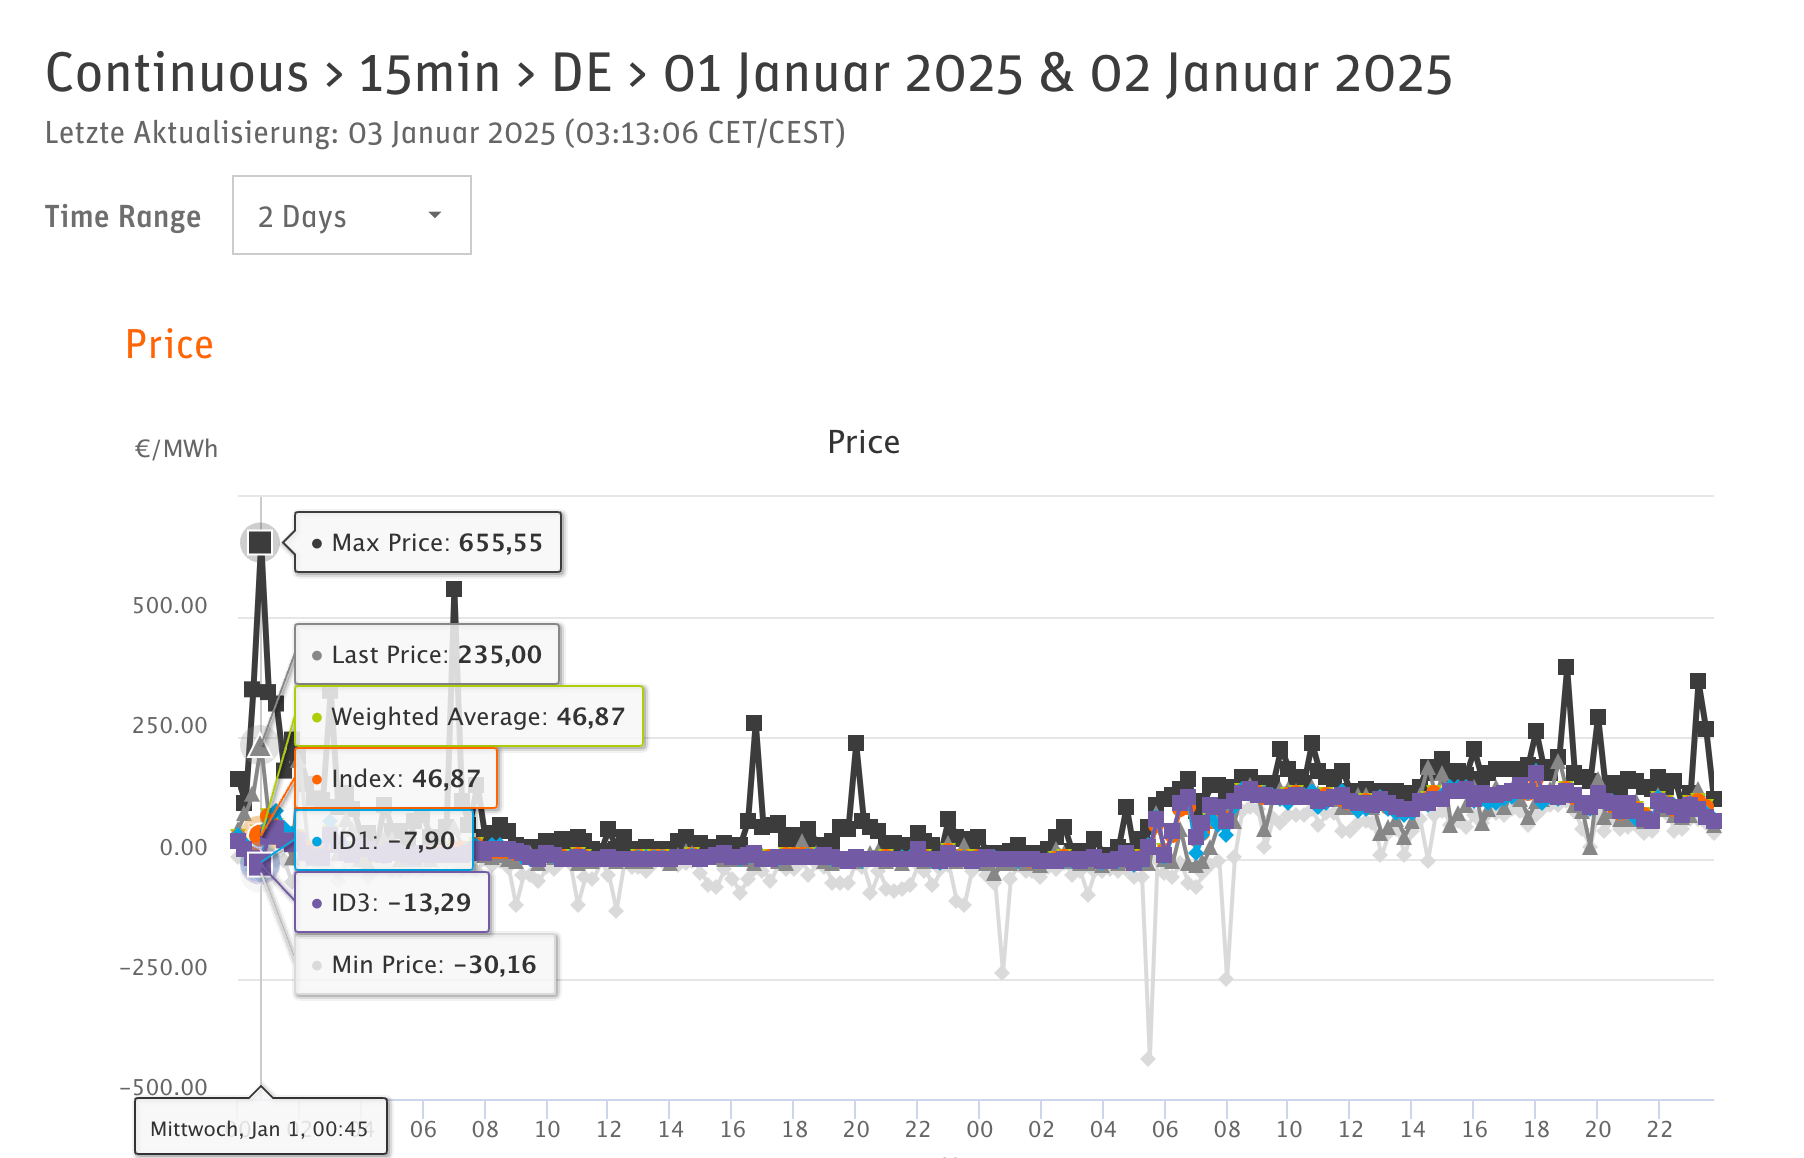
We enjoy posts by influencers, but we are also aware that there are additional levels of interesting detail and complexity to think about (imagine life otherwise). Consider, for example, that market participants with short term needs paid up to 655,55 EUR/MWh in the first hour of 2025.
What do large spreads between averages and maximum/minimum prices tell us? Putting Day-Ahead Auctions aside for a moment, looking at the summary market data for the first few days of the year, I was struck by some of the large deviations between volume weighted average prices and minimum/maximum transaction prices.
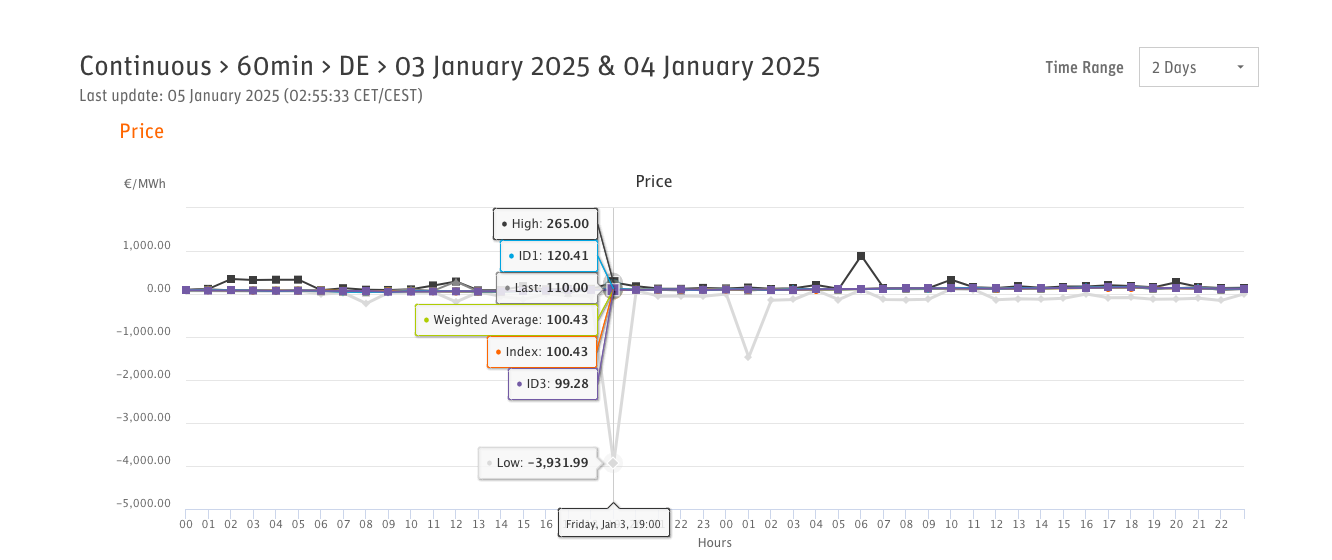
For example, the lowest price for the 03-01-2025 19:00-20:00 product was -3,931.99 EUR/MWh, whereas the volume weighted average price over all transactions was 100.43 EUR/MWh, a difference of 4032.42 EUR/MWh.
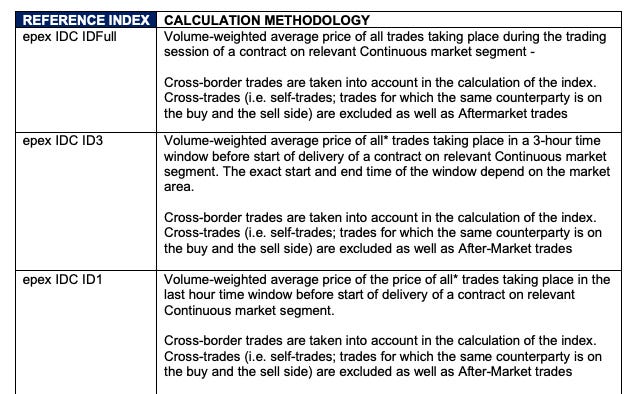
For completeness and, if necessary, as a brief primer, recall the definitions for ID1, ID3, and the full VWAP.
2. The “High/Low to VWAP” Spread and liquidity
We are going to think about the difference between a VWAP price and the minimum and maximum prices at which volume was traded. It doesn’t matter much which of ID1, ID3, or IDFull we take, so we’ll take IDFull for completeness.
We haven’t got detailed data of the order book, which would set us back about 3900 EUR in addition to significant time spent to analyse a very large dataset.
