
Forecasts and actuals
Groundwork

It snowed around here on 24.12. and the day after, walking around and looking out across some fields, I was struck by how mole-hills gain prominence in the snow. A newsletter writer is a bit like a mole raising mounds of collected material to the surface, focused on making a way, not on the outward effects… the surface will take care of itself. Today we tunnel towards a continuation of our “variability swap” series.

We’re looking at forecasts today… Forecasts for load and generation levels set expectations. Expectations turn into strategies for the day(s) ahead. How error prone are the forecasts? How certain are our expectations? How adaptable are our strategies?

We’ll get the data that we need from Energy-Charts. Last time we saw how Energy-Charts is part of an approach to the energy markets that we termed the “Burger Doctrine.” Exploring visualised data on energy-charts is an excellent way to stay in touch and build familiarity with the system. For our purposes, however, we’ll always want to dig deeper and work with the data directly.

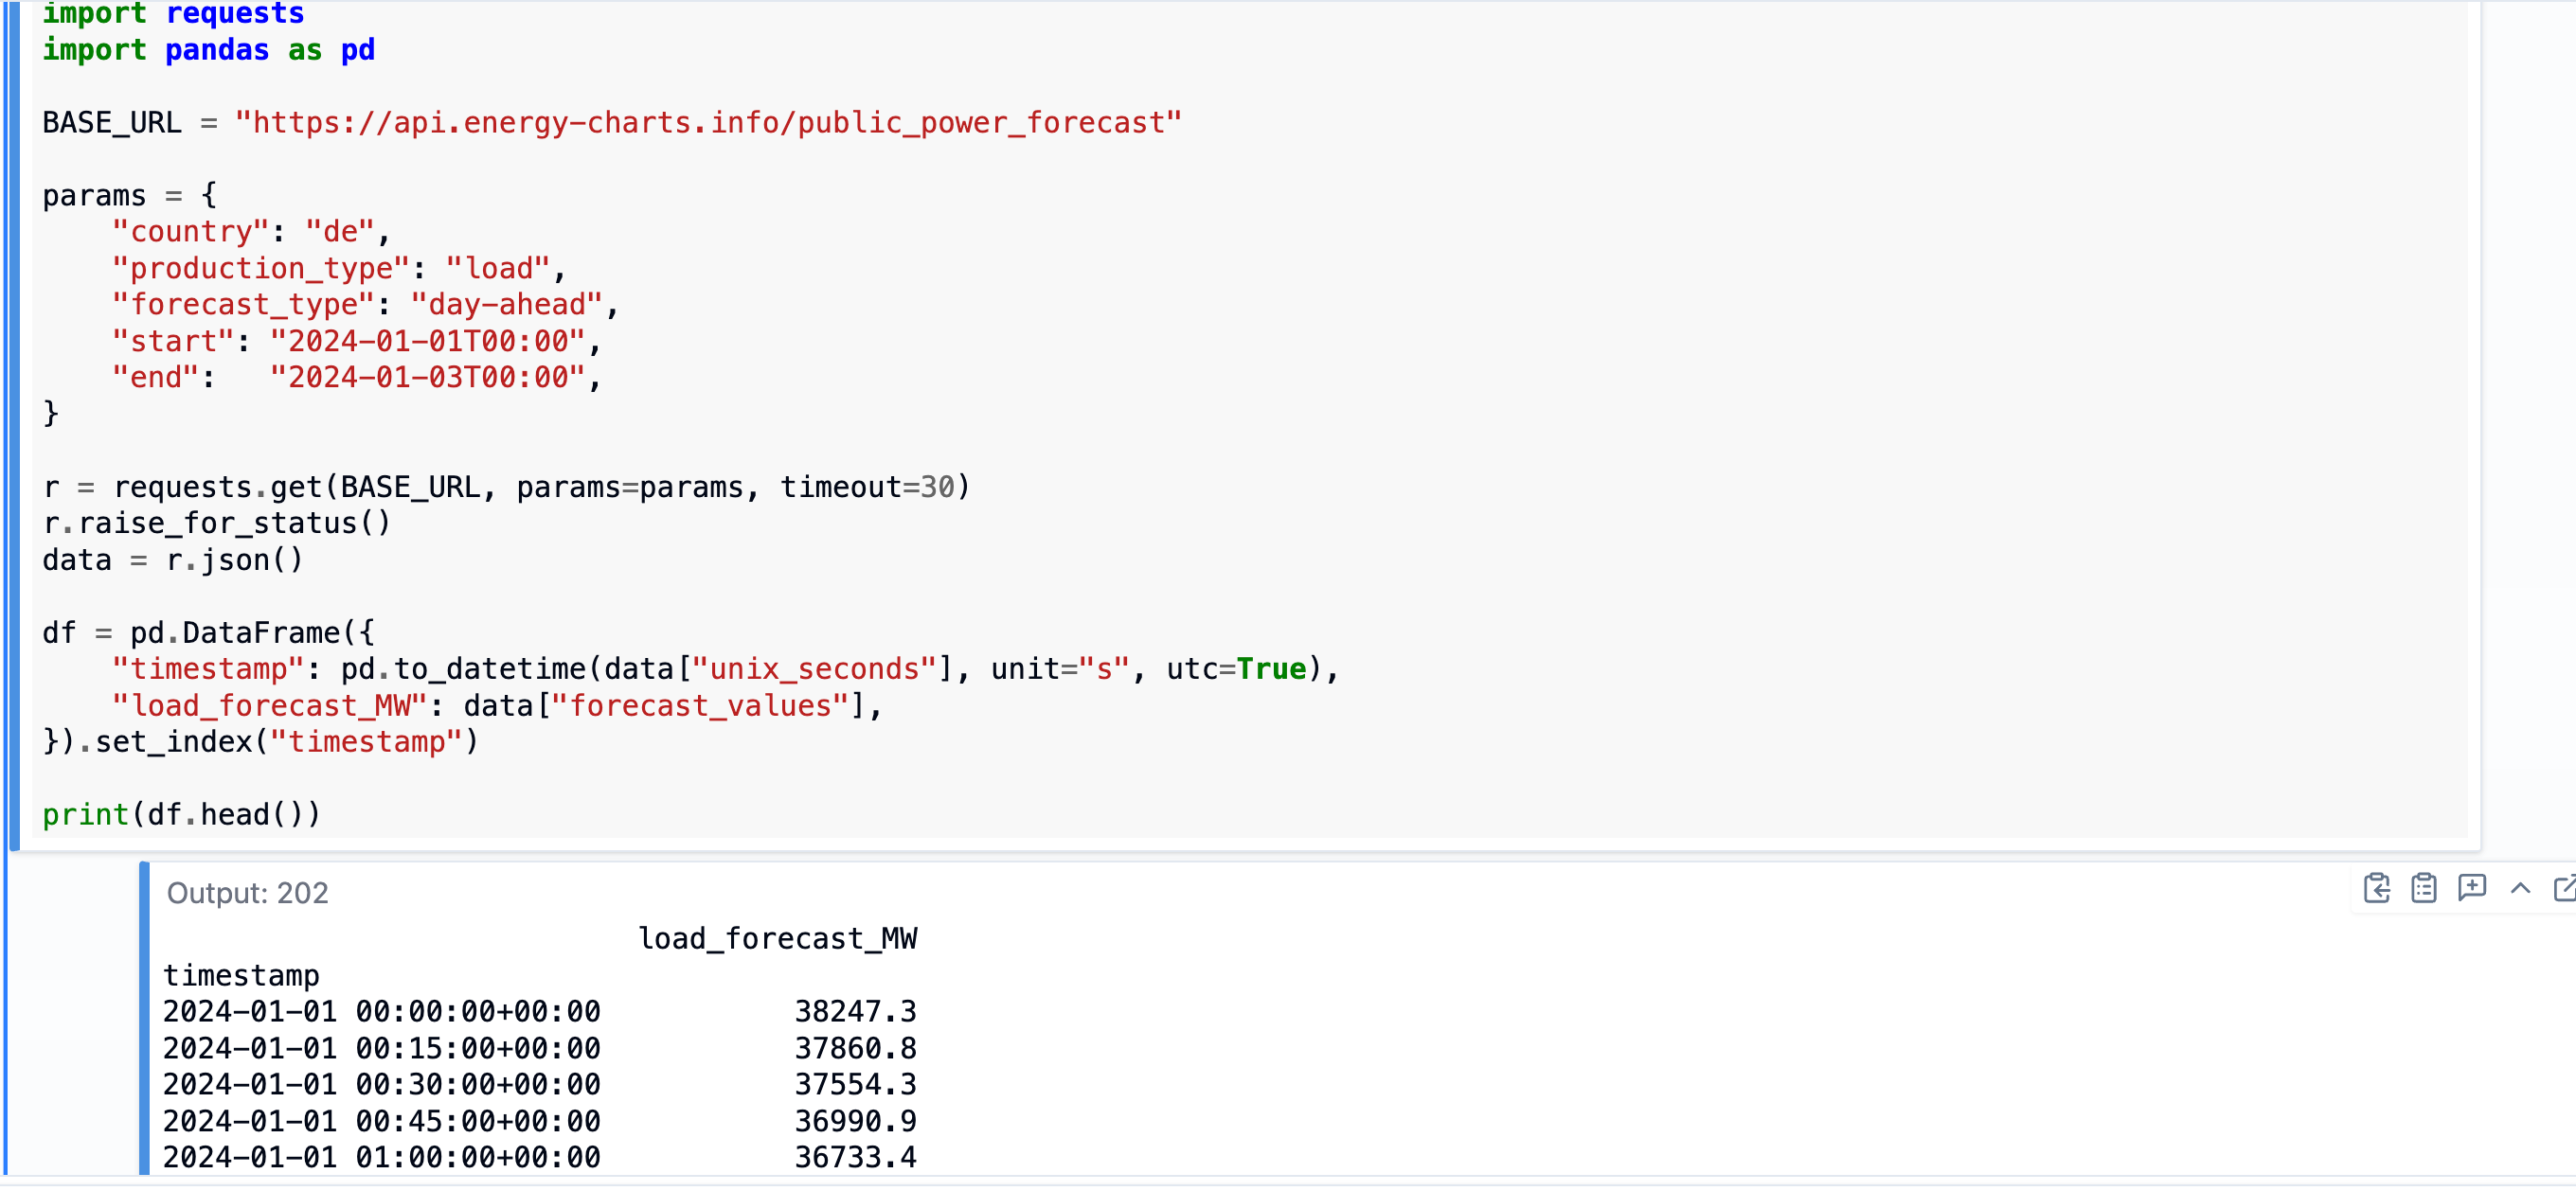
Energy-Charts exposes some of the data it builds on through a well-documented API. (My appreciation for this API deepened recently after trying to work with ENTSOE data directly.) Here’s an illustration of how to get day-ahead load forecasts.
Forecast vs Actual
We’ll focus on three sets of forecasts and actuals: load, solar generation, wind generation (onshore and offshore). These can be brought together to give forecasts and actuals for residual load (load minus wind and solar).
Here’s a comparison of day-ahead forecasts and actual realised values at 15-minute resolution over roughly two years.
