
A Market-Season Lens For Germany's Power Market. Q4 25-Q2 26.
From winter compression to spring solar ramp and the early-April repricing.

An update on market seasons and regimes from the stratnergy analytics engine puts recent market events into context. The engine has developed from initial versions (Part I, Part II). See also the live version, which will develop to integrate this seasonal layer in due course.
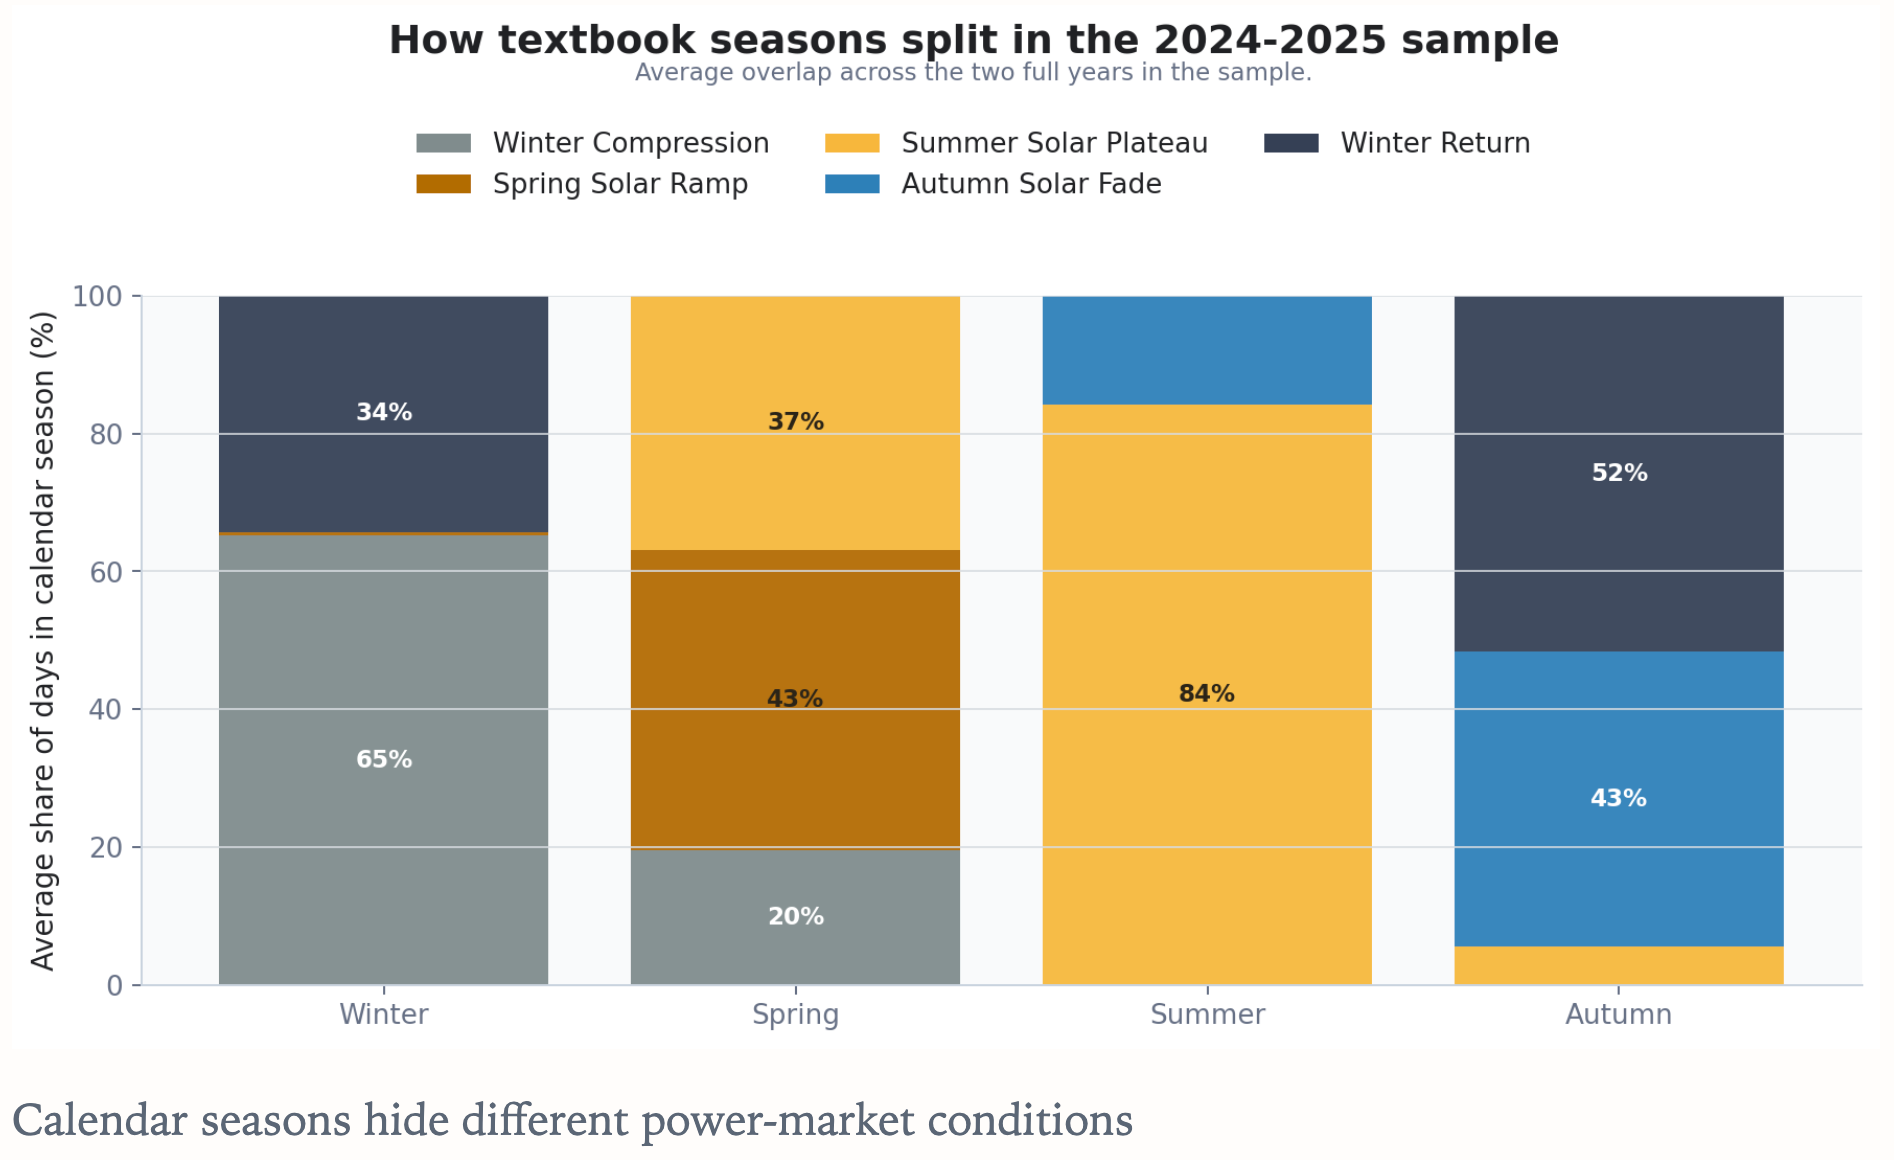
Calendar seasons are too ‘blunt’ for the German power market. They do not capture the move from a winter-compressed system into a spring market in which the middle of the day can soften sharply while the later system remains firmer.
…the recurrence of all sorts of days which not only nature, but adventitious circumstances, a purely conventional order, introduce into a season. Marcel Proust
A market-season vocabulary helps to identify the path more clearly than calendar seasons alone. In this report window, the useful sequence is Autumn Solar Fade, Winter Return, Winter Compression, and Spring Solar Ramp.
Seasonality in the German Energy Market
Autumn Solar Fade: the high-solar period rolls away gradually rather than disappearing at a calendar boundary.
Winter Return: solar falls back toward single digits and the system begins to feel winter-like again.
Winter Compression: the deepest winter-like stretch, with weak solar and a system that still behaves as if winter is in charge.
Spring Solar Ramp: solar is back strongly enough to soften the middle of the day, but the market has not yet settled into a summer plateau.
Summer Solar Plateau sits beyond this sample, but we will get there soon enough!
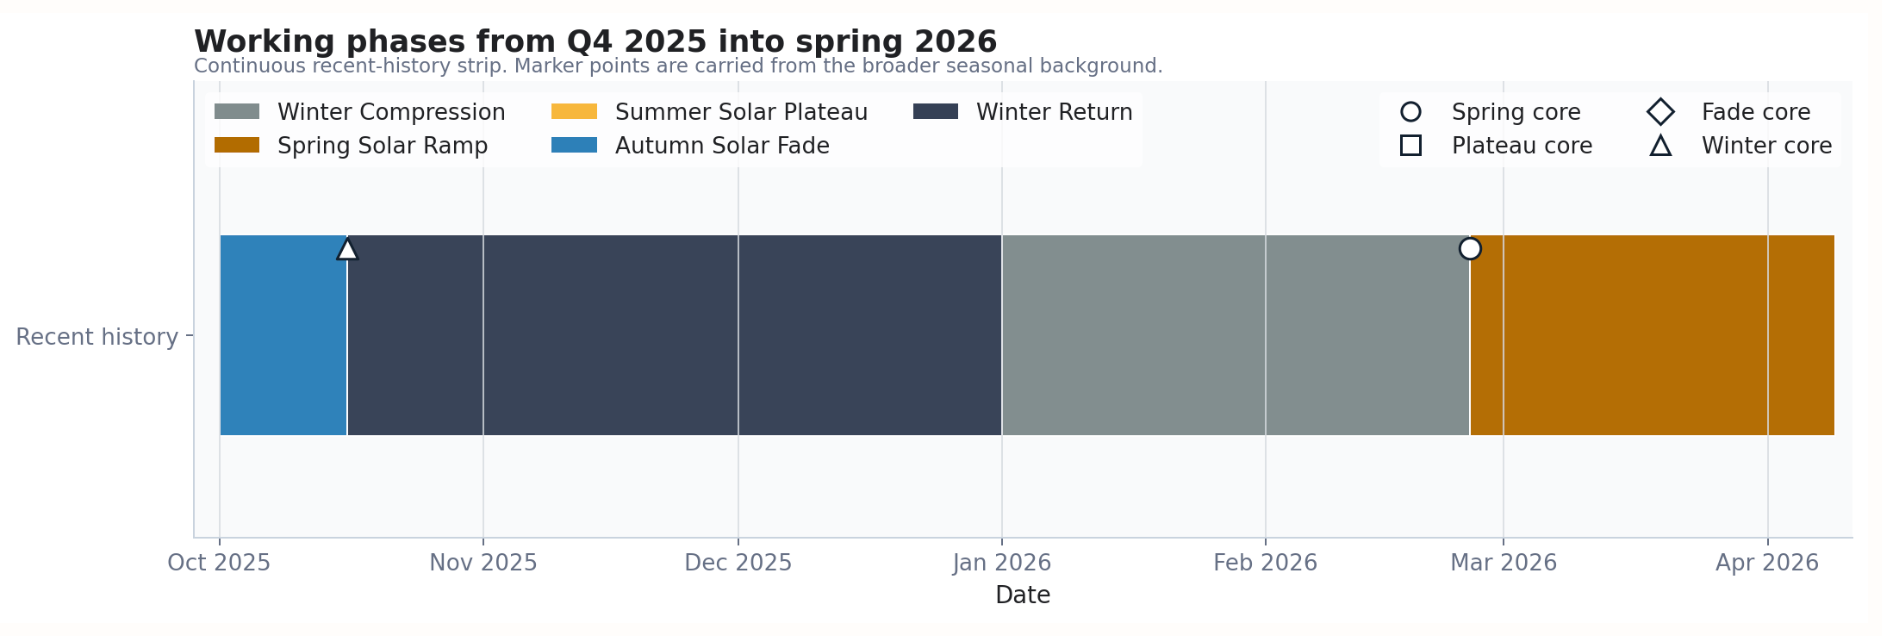
Between 2025-10-01 and 2026-04-08, as we’ll see below, the market moved from autumn fade into winter return, tightened into winter compression, and then opened into a spring solar ramp.
Autumn Solar Fade (2025-10-01 to 2025-10-15): 15 days, average solar share 11.4%, average load 53.2 GW, dominant regime Surprise dislocation regime.
Winter Return (2025-10-16 to 2025-12-31): 77 days, average solar share 5.4%, average load 57.1 GW, dominant regime Compressed baseline regime.
Winter Compression (2026-01-01 to 2026-02-24): 55 days, average solar share 4.2%, average load 62.4 GW, dominant regime Compressed baseline regime.
Spring Solar Ramp (2026-02-25 to 2026-04-08): 43 days, average solar share 20.3%, average load 56.9 GW, dominant regime Mixed transition regime.
…that fresh and piercing novelty of a recurring season, of a change in the routine of our hours… Marcel Proust
Winter gave us a Low-Low Baseline
Winter Return was the settling phase after the autumn fade: solar averaged 5.4%, load about 57.1 GW, and the dominant read was Compressed baseline regime. Winter Compression then deepened that structure. Solar slipped another 1.2 percentage points to 4.2%, load rose by roughly 5.3 GW to 62.5 GW, and the market stayed under the same compressed-baseline label.
And when I thought how I would see the return of that cold season which … had always seemed to me so melancholy, when I thought how evenings would come back like that snowy evening … what at such moments I still dreaded most…was the return of the intense cold, and I said to myself that what it would be hardest to live through was perhaps the winter. Marcel Proust
That winter baseline was also quieter in spread terms. Winter Return and Winter Compression were relatively contained SPARX regimes. Once the market moved into Spring Solar Ramp, both the average stress level and the upper tail moved materially higher. The spring market was not just brighter. In this sample, it left the market more exposed to intraday shape risk.
That is the baseline against which spring should be read. Once Spring Solar Ramp arrived on 2026-02-25, solar had climbed back far enough and load had eased far enough for the middle of the day to soften much more easily than it could in January.
Spring Repriced The Middle Of The Day
By late February, the market was no longer behaving like a winter system. Once it moved into Spring Solar Ramp, solar started reshaping the middle of the day more consistently. Midday pricing could soften much more easily, even while later-day tightness remained possible.
…a decanted springtime, which is reduced to its own essence and expresses the lengthening, the warming, the gradual unfolding of its days.. Marcel Proust
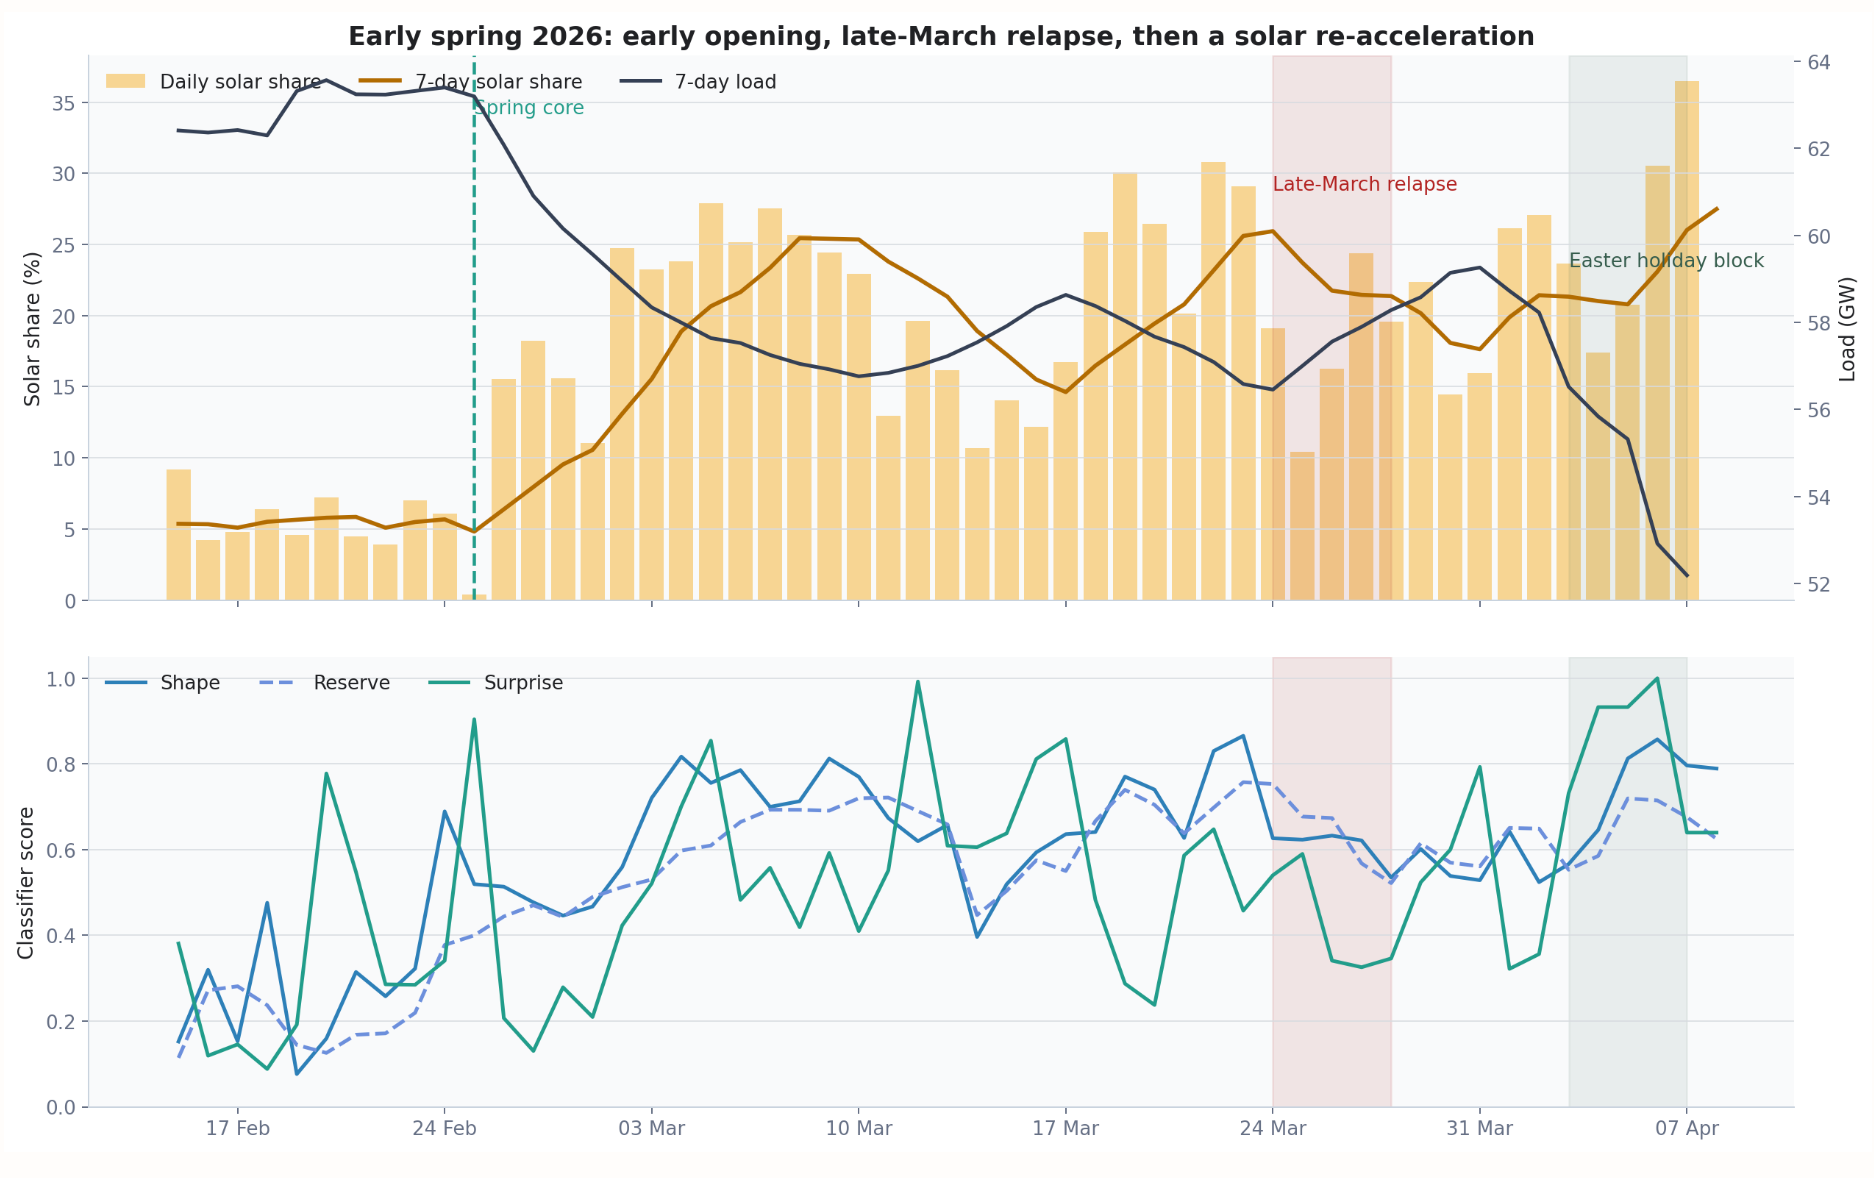
Three parts of that spring turn matter here. After 2026-02-25, solar moved into a higher operating range and stayed there much more often than in winter. Late March then wobbled without fully resetting the spring pattern: solar eased, load firmed, but the score layer stayed active instead of dropping back to the quieter early-February read. The Easter block belongs inside that same setting. Spring already looks like its own operating environment rather than a brief transition out of winter.
A useful late-March comparison window runs from 2026-03-24 to 2026-03-27, when the spring opening wobbled without fully resetting. The early-April holiday block in this report runs across Good Friday on 2026-04-03, Easter Sunday on 2026-04-05, and Easter Monday on 2026-04-06.
Early April Was A Shape Event
Easter Monday was a decisive break. It landed inside Spring Solar Ramp, with unusually weak demand, strong solar, and the daily classifier already in Surprise dislocation regime. DA average still sat near flat at EUR 3.04/MWh, but settled SPARX reached EUR 4274.16/MWh.
…from the muffling of sounds in the heat of the morning hours, the cool taste of cherries; the longing for Brittany or Venice from the noise of the wind and the return of Easter… Marcel Proust
Some of the setup was visible before Monday. By 2026-04-03, the classifier had already shifted into Surprise dislocation regime. By 2026-04-05, DA average was at EUR -16.34/MWh, and the 12-16 block had already turned sharply negative. A soft holiday midday was already in the day-ahead structure.
Day-ahead already showed a soft midday shape on 2026-04-06, but, in retrospect it does not capture the eventual scale of the break. 12-16 cleared at EUR -103.33/MWh, but 16-20 still printed EUR 30.50/MWh and 20-24 EUR 111.97/MWh. That left a 12-16 versus 20-24 day-ahead gap of EUR 215.30/MWh on the same curve. On the realised quarter-hour path, the intraday-minus-day-ahead spread still ranged from EUR -4233.90 to EUR 40.26/MWh across the day. That is why Monday produced the largest SPARX break in the sample.
