
When does the tail wag the dog?
Variability swaps VII... perhaps.

What do we mean when we talk about a ‘regime change’ in economics or finance? And what does it have to do with (positive) feedback loops?
I think it’s helpful to think in simple images and examples. We’re good at this. Ducks are regularly featured in the energy industry.
But today I would like us to think about dogs.
Imagine an excited dog wagging its tail, the excitement growing, the tail wagging faster, and faster, reaching maximum speed, reaching the physical limits of the dog and the whole dog now shaken by its tail, out of control: now helplessly wagged by its tail, unsure what made it excited in the first place.
This post tries to argue that the aFRR negative capacity market is a bit like that dog, sometimes.
The chart below shows the bid distribution for aFRR negative capacity for 12-16:00, arguably the most interesting of all ancillary capacity products.
It’s an obvious plot to make if you’re going to explore the aFRR markets, and by the end of this post, I hope you’ll agree that it deserves a place alongside the ‘duck curve.’ Perhaps we could call it the ‘dog curve’?
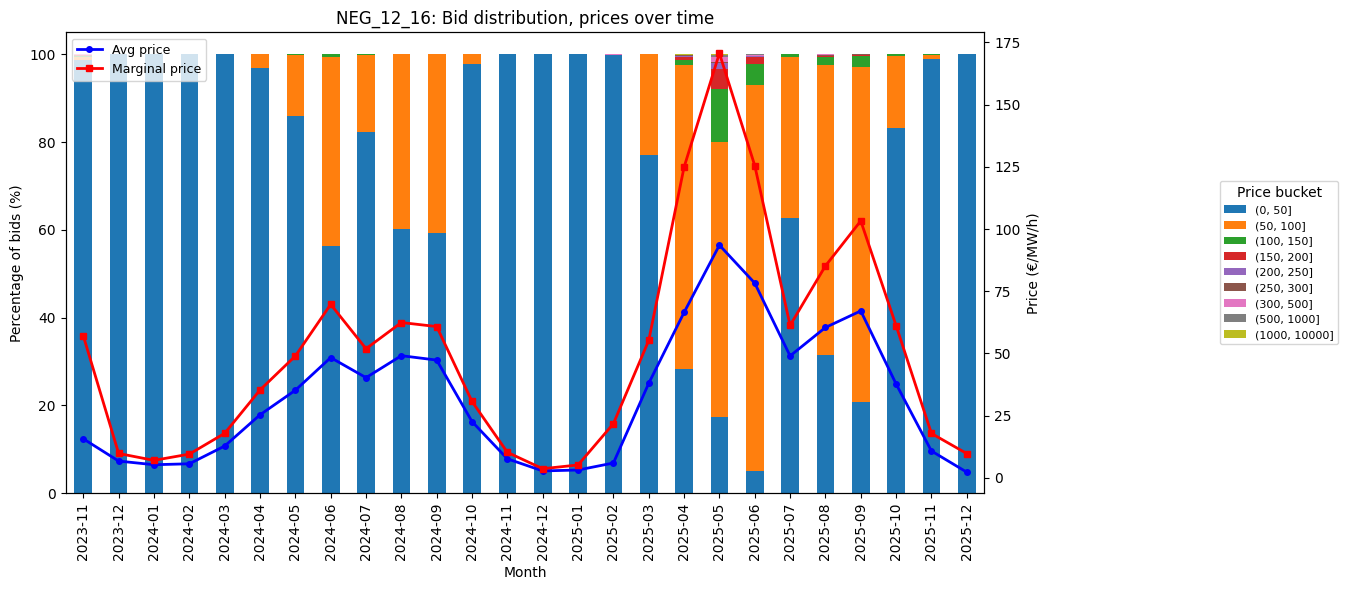
Clearly something changes in April 2025 (relative to 2024, at least). Up until then, as we’ll see below, bid curves were relatively smooth and stable, volatility limited.
I like stacked bar-charts, they trigger memories of time in the Zeeman building (Warwick): Is 2025 the start of something bigger? If so, the “dog chart” may soon end up as colourful as Davenport’s “Everything.”

This spontaneous connection between ancillary services and E.C. Zeeman may be productive for this newsletter in future. But for now, let’s just bring in this wonderful quote:
Another of my hobby-horses is the advantage of ignorance, in that it encourages creativity, both in the young and the old. Catastrophe theory. Zeeman, E. C
We might adopt this as our guiding principle as we continue experiments in our new environment.

Back to ducks and dogs. What changed in 2025 (in the aFRR negative capacity market)?
With encouragement from Zeeman, the intuition that I would like to share here is that there is a useful connection between the 2025 shift in the aFRR markets and the thinking we have developed in our ‘variability swap’ series.
aFRR negative capacity as a variability swap? This post may be the prequel to the next instalment of our running flagship classic. Let’s see how we go.
Variability Swaps VI.

This series is about exploring interesting conceptual connections between energy market instruments and variance swaps. The theory of variance swaps and volatility in the capital markets is comparatively mature and the aim is to see if we can use some of this maturity to inform our thinking about developments in the energy markets. Links to previous instalments:
Before we get too excited, let’s take it step by step with a ‘dog plot’ walkthrough. Prepare the plastic bags… this may go anywhere.
